
Relating profitability, productivity, and growth to specific manufacturing management practices has been a matter of guesswork, intuition, and anecdotal evidence until recently. New research indicates that certain practices—especially performance monitoring—are indeed correlated with positive business results.
The study, the Management and Organizational Practices Survey (MOPS), was carried out by a team of researchers from Stanford, MIT, the London School of Economics, and the U.S. Census Bureau. It was conducted to investigate relationships between manufacturing management practices and business results.
30,000 manufacturing establishments (as the Census Bureau refers to business locations that may be either independent or part of a larger organization) responded to the MOPS survey about “structured management practices,” which included performance monitoring, target setting, and incentives*.
A method was developed by the team for scoring the intensity with which structured management practices are used. Analysis of the survey responses along with production, sales, profits, and employment data from the Census Bureau indicates a link between the management scores and:
-
- Higher profitability
-
- Greater productivity
-
- Faster employment growth
More profitable? According to survey team member, Dr. Nicholas Bloom of Stanford, “This survey said that profitability—calculated as profit/sales—goes up by 0.58% for every 10% increase in the management score. So going from 0.5 to 0.75 on the management score would be associated with an increase in profitability of about 1.5%.”
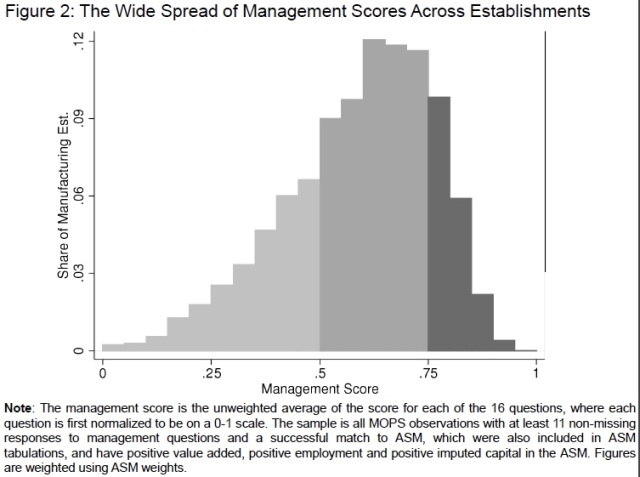
How many U.S. companies are using performance monitoring, targets, and incentives as described in the survey? Of the 30,000 establishments studied, 18% have adopted at least 75% or more of them. 27% of establishments are using less than half of the practices in the questionnaire. Most companies reported using between 50 and 75% of them.
This graph shows that the number of companies using practices included in the study.
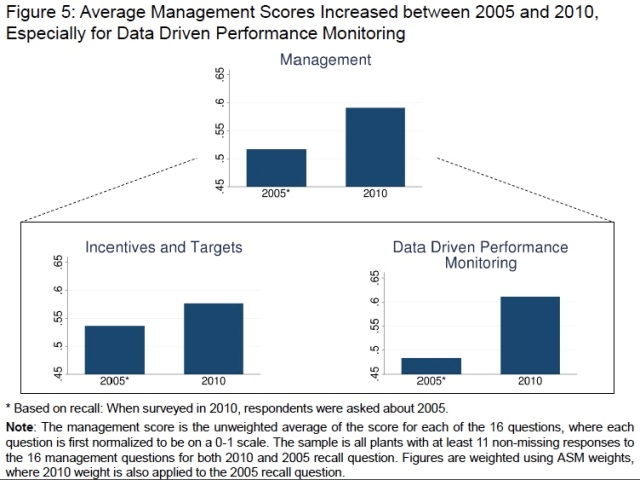
How has the use of structured management practices changed between 2005 and 2010? Average management scores for intensity of use were compared. Bloom says, “As shown on the report’s Figure 5, the average in 2005 was a bit higher than 50%. By 2010, the average was up to 60%, an increase of almost 15%.”
According to the research team, much of the increase was due to more use of data-driven performance monitoring. This may be where companies will want to focus adoption of structured management practices in order to compete in a marketplace where 18% of firms are already scoring above 75%. They can start by defining key performance indicators, tracking them, sharing the results widely, and demonstrating that managers care about them.
Does this data support the use of lean manufacturing or other leading-edge manufacturing management philosophies? In truth, 16 questions about tracking KPIs and incentivizing employees can’t be said to cover much of what we’d call lean—after all, Shingo Prize, Baldrige, and other lean assessment tools are many pages long and take days to evaluate. But if some data is better than no data – especially when it covers 30,000 manufacturing facilities – giving us a little more insight into what practices are used in the most profitable, productive, and growing companies.
Find out if lean applies to you.
Read more about why management matters to manufacturers.
Karen Wilhelm has worked in the manufacturing industry for 25 years, and blogs at Lean Reflections, which has been named as one of the top ten lean blogs on the web.
* Performance monitoring questions included the number of key performance indicators (KPIs) monitored, how frequently managers and non-managers reviewed them, and where KPI display boards were located. The survey also asked about targets for KPIs such as production, quality, efficiency, waste, on-time delivery, cost, and inventory. Then there were questions about rewards for managers and non-managers for achieving targets and how both groups were evaluated and promoted, reassigned, or asked to leave the company. Each question was to be answered for 2005 and for 2010, allowing change to be measured over time.